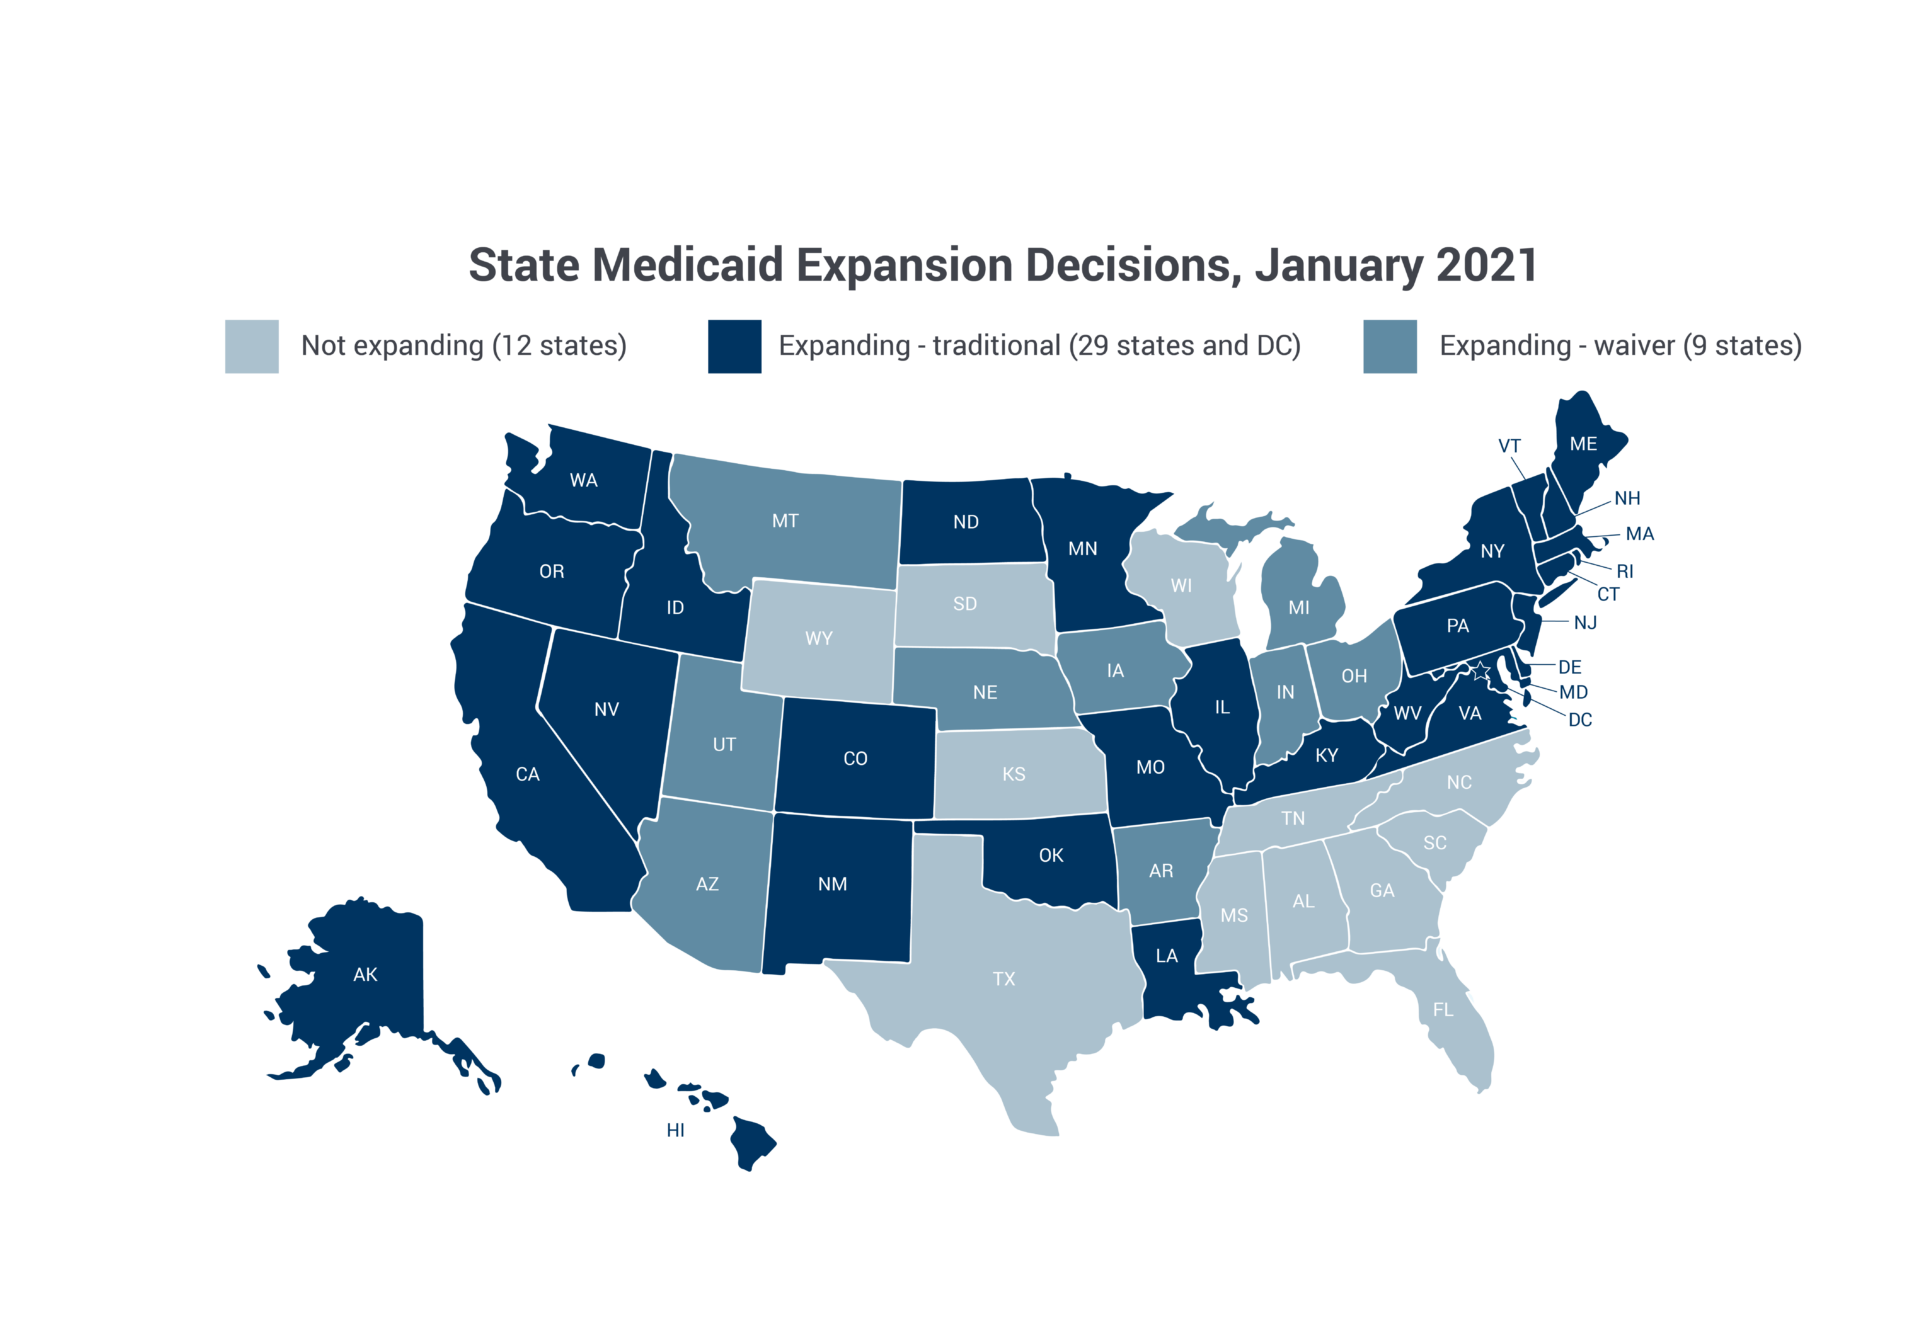
The Patient Protection and Affordable Care Act (ACA, P.L. 111-148, as amended) establishes new avenues to coverage for low- and moderate-income individuals. As enacted, the law required states to extend Medicaid eligibility to adults with incomes below 133 percent of the federal poverty level (FPL), although the June 2012 Supreme Court ruling in National Federation of Independent Business v. Sebelius effectively made the expansion optional for states. For more information, see Medicaid expansion to the new adult group.
Data suggest that Medicaid and State Children’s Health Insurance Program (CHIP) enrollment has increased following implementation of the ACA, while the rate of individuals without insurance has declined (Berchick et al. 2019). In 2019, national enrollment declined but this was not true in all states. Overall, there does not appear to be a consistent pattern among states experiencing declines in enrollment or a single explanation for the changes across the states (MACPAC 2019).
Data since 2020 indicate that Medicaid enrollment has increased again following the onset of the COVID-19 pandemic, in part due to the requirement that states provide continuous coverage as a condition of increased federal funding during the federal public health emergency. (CMS 2021, Frenier et al. 2020 HMA 2020).
For more information, see Changes in coverage and access.
Medicaid enrollment changes nationally
Overall, as of March 2020:
- 71.6 million individuals are enrolled in Medicaid or CHIP, and
- enrollment increased by 14.0 million among the 49 states reporting both baseline (July–September 2013) and March 2020 data.[1]
This represents a 24.7 percent increase over the baseline (CMS 2021).
Medicaid enrollment increases in expansion states
States that expanded Medicaid to cover the new adult group showed the largest growth in enrollment. Between July and September 2013 and March 2020:
- enrollment in Medicaid expansion states increased by 13.0 million or 33.9 percent;
- 22 of these states saw increases in enrollment of at least 25 percent;
- increases ranged from 2.9 percent in Delaware to 113.5 percent in Kentucky; and
- one expansion state (Vermont) experienced a decline in enrollment Kentucky (CMS 2021).
Growth in Medicaid enrollment has been driven primarily by adults qualifying under the adult group (MACPAC 2016). As of March 2020:
- Enrollment in the new adult group made up 20.7 percent of Medicaid enrollment across all reporting states (CMS 2021).
- At that time, the 35 expansion states and the District of Columbia reported a total of 12.3 million enrollees in the new group. Of these, 81.2 percent were newly eligible individuals and entitled to the newly eligible enhanced federal matching rate (CMS 2021).[2]
Increased enrollment among previously eligible individuals
Medicaid enrollment has grown regardless of expansion status in most states following implementation of the ACA. This is likely due to the so-called welcome-mat effect in which enrollment increases among individuals who were previously eligible for coverage but not enrolled. One of the underlying reasons for the welcome-mat effect may be that previously eligible individuals may not have known they were eligible for coverage and applied as a result of increased outreach efforts surrounding ACA implementation.
In non-expansion states, growth in Medicaid enrollment was lower than in Medicaid expansion states. Between July and September 2013 and March 2020:
- enrollment increased by 939,321 or 5.2 percent;
- these increases ranged from 0.1 percent in Texas to 20.8 percent in Georgia;
- enrollment declined in five non-expansion states (CMS 2021).
In addition, while children’s eligibility was not affected by state decisions to expand to the new adult group, enrollment in Medicaid and CHIP has also grown among children in both expansion states and non-expansion states. As of March 2020, 35.4 million children were enrolled in Medicaid or CHIP in 49 reporting states and the District of Columbia, with child enrollment comprising nearly half (49.4 percent) of enrollment in these states (CMS 2021).[3]
Alignment with projections
The Congressional Budget Office’s (CBO’s) initial projections suggested that by 2015, enrollment in Medicaid and CHIP would increase by 15 million and the number of uninsured would decline by 25 million (CBO 2010). However, following the Supreme Court ruling and the initial implementation struggles with the federal and state exchanges, CBO revised its coverage estimates under the ACA. As of March 2015, CBO estimated that 10 million additional people would be enrolled in Medicaid and 17 million fewer people would be uninsured (CBO 2015). As of March 2020, Medicaid enrollment has increased by 14.0 million from the pre-ACA baseline (CMS 2021). There were 13.3 million fewer uninsured individuals in 2017 compared to 2013 (Berchick et al. 2018).